


Year on Year Sales & Market Share Charts - October 20, 2018 - Sales
by William D'Angelo , posted on 06 November 2018 / 5,484 ViewsHere we see data representing the global sales through to consumers and change in sales performance of the four home consoles and four handhelds over comparable periods for 2015, 2016, 2017, and 2018. Also shown is the market share for each of the consoles over the same periods.
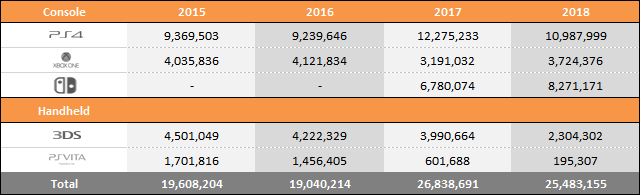
Year to Date Sales Comparison (Same Periods Covered)
Market Share (Same Periods Covered)
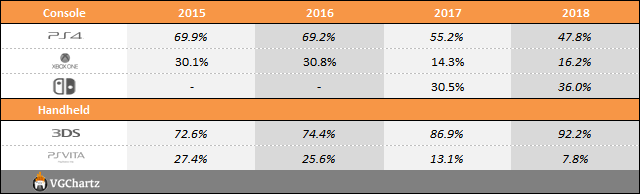
2015 – (Week ending January 10 to October 24)
2016 – (Week ending January 9 to October 22)
2017 – (Week ending January 7 to October 21)
2018 – (Week ending January 6 to October 20)
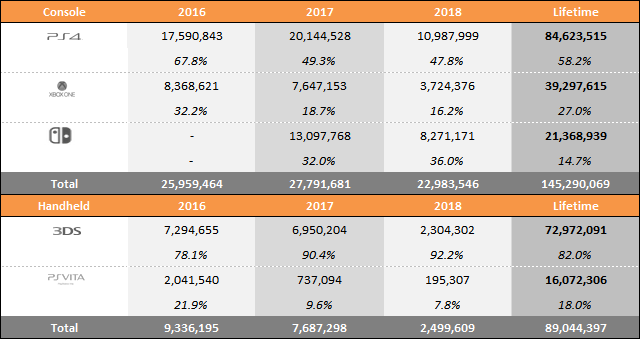
Total Sales and Market Share for Each Year
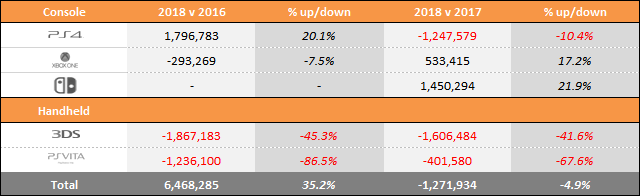
"Year to date" sales for 2015, 2016, 2017, and 2018 sales are shown in series at the top of the table and then just below a comparison of 2018 versus 2017 and 2018 versus 2016 is displayed. This provides an easy-to-view summary of all the data.
Microsoft
- Xbox One – Up Year-on-Year 533,344 (16.7%)
Nintendo
- Nintendo Switch - Up Year-on-Year 1,491,097 (22.0%)
- Nintendo 3DS – Down Year-on-Year 1,686,362 (-42.3%)
Sony
- PlayStation 4 – Down Year-on-Year 1,287,234 (-10.5%)
- PlayStation Vita – Down Year-on-Year 406,381 (-67.5%)
A life-long and avid gamer, William D'Angelo was first introduced to VGChartz in 2007. After years of supporting the site, he was brought on in 2010 as a junior analyst, working his way up to lead analyst in 2012. He has expanded his involvement in the gaming community by producing content on his own YouTube channel and Twitch channel dedicated to gaming Let's Plays and tutorials. You can contact the author at wdangelo@vgchartz.com or on Twitter @TrunksWD.
More Articles

The second image (2018 vs 2017 and 2016) is the same from last week

If the percentages up/down stay the same for the full year, the PS4 should sell 18M in 2018, the XBox 9M and the Switch 16M. I have the strong feeling though, that the losses/wins will not stay proportional.

If I’m not mistaken, it looks like since the release of Spider Man that PS4 2018 is closing the gap now with 2017. I can’t see it closing it completely, but it’s going to be close, which is still very impressive for the console’s fist year on the down slope.

Ps4 already has, according to sony, 86m at the end of Q2. Probably today, slightly above the numbers for 2017.

86m shipped, not sold to consumers...


 Essay Pro