PS5 vs Xbox Series X|S vs Switch 2022 Sales Comparison Charts Through July 30 - Sales
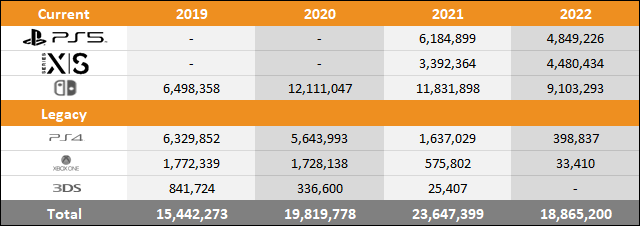
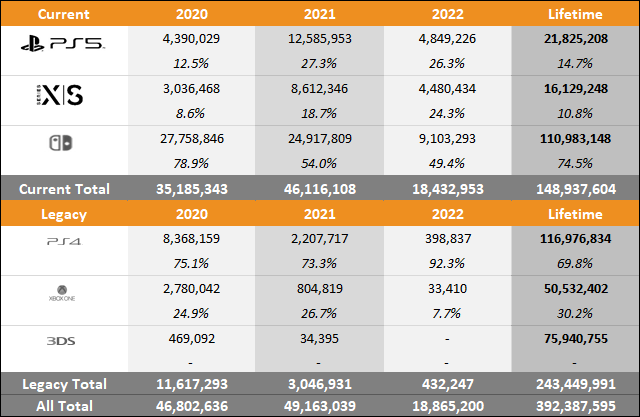
by William D'Angelo , posted on 09 August 2022 / 4,859 ViewsHere we see data representing the global sales through to consumers and change in sales performance of the three current platforms (PlayStation 5, Xbox Series X|S, and Nintendo Switch) and three legacy platforms (PlayStation 4, Xbox One, and Nintendo 3DS) over comparable periods for 2019, 2020, 2021, and 2022. Also shown is the market share for each of the consoles over the same periods.
Year to Date Sales Comparison (Same Periods Covered)


Market Share (Same Periods Covered)

2019 – (Week ending January 12 to August 3)
2020 – (Week ending January 11 to August 1)
2021 – (Week ending January 9 to July 31)
2022 – (Week ending January 8 to July 30)
"Year to date" sales for 2019, 2020, 2021, and 2022 sales are shown in series at the top of the table and then just below a comparison of 2022 versus 2021 and 2022 versus 2020 is displayed. This provides an easy-to-view summary of all the data.
Total Sales and Market Share for Each Year

Microsoft
- Xbox Series X|S
- 4.48 million units sold year-to-date
- Up year-on-year 1,088,070 units (+32.1%)
- Xbox One
- 0.03 million units sold year-to-date
- Down year-on-year 542,392 units (-94.2%)
Nintendo
- Nintendo Switch
- 9.10 million units sold year-to-date
- Down year-on-year 2,728,605 units (-23.1%)
Sony
- PlayStation 5
- 4.85 million units sold year-to-date
- Down year-on-year 1,335,673 units (-21.6%)
- PlayStation 4
- 0.40 million units sold year-to-date
- Down year-on-year 1,238,192 (-75.6%)
A life-long and avid gamer, William D'Angelo was first introduced to VGChartz in 2007. After years of supporting the site, he was brought on in 2010 as a junior analyst, working his way up to lead analyst in 2012 and taking over the hardware estimates in 2017. He has expanded his involvement in the gaming community by producing content on his own YouTube channel and Twitch channel. You can contact the author on Twitter @TrunksWD.
More Articles
Sony says they want to move 18m units this fiscal year and right now they are roughly at 5m. They have 33 weeks left to make up the remaining 13m. That comes out to roughly 300k+ a week. Maybe they can pull it off... i mean they have had some pretty good weeks above 200-240k lately.
MS, I dont think, set any kind of unit goal. So anything they do this year is already above what they did last. Trending 5-6 months ahead of XBO... they should be able to hit 24m by end of the year, if not sooner.
This fiscal year started in April, they shipped 2.4m from then until end of June. I can guarantee they haven't shipped close to 5m yet.
Sales wise if you are using VGC then the current sales since April is about 3.1-3.2m in 17-18 weeks (The April sales on VGC data is 5 weeks including some days in March) There are 35 sales data weeks left before April 2023. The average weekly sales needs to be 425k
Given the recent improvement I don't think it's impossible, if they are capable of this level of weekly sales and can also hold some for holiday boost maybe 18m will be possible, but they definitely have more than 13m to go whichever way you look at it.


 Essay Pro