


Year on Year Sales & Market Share Charts - February 9, 2019 - Sales
by William D'Angelo , posted on 01 March 2019 / 3,579 ViewsHere we see data representing the global sales through to consumers and change in sales performance of the four home consoles and four handhelds over comparable periods for 2015, 2016, 2017, and 2018. Also shown is the market share for each of the consoles over the same periods.
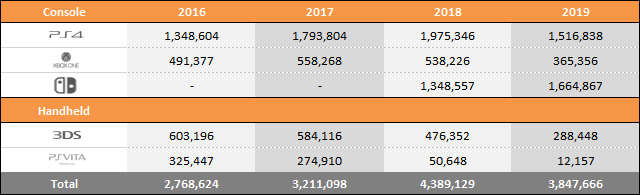
Year to Date Sales Comparison (Same Periods Covered)
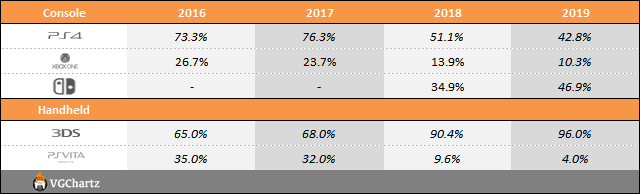
Market Share (Same Periods Covered)
2016 – (Week ending January 9 to February 13)
2017 – (Week ending January 7 to February 11)
2018 – (Week ending January 6 to February 10)
2018 – (Week ending January 5 to February 9)
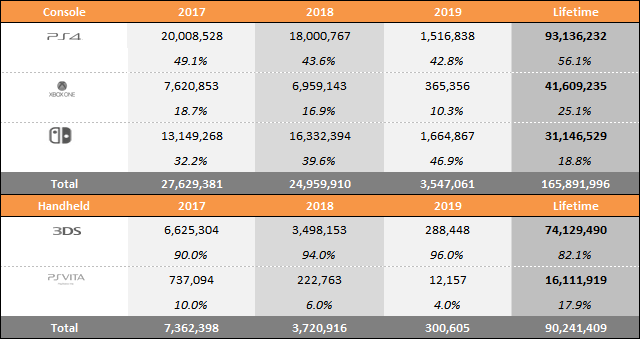
Total Sales and Market Share for Each Year
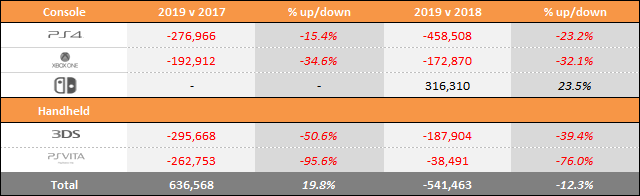
"Year to date" sales for 2016, 2017, 2018, and 2019 sales are shown in series at the top of the table and then just below a comparison of 2019 versus 2018 and 2018 versus 2017 is displayed. This provides an easy-to-view summary of all the data.
Microsoft
- Xbox One – Down Year-on-Year 172,870 (-32.1%)
Nintendo
- Nintendo Switch - Up Year-on-Year 316,310 (23.5%)
- Nintendo 3DS – Down Year-on-Year 187,904 (-39.4%)
Sony
- PlayStation 4 – Down Year-on-Year 458,508 (-23.2%)
- PlayStation Vita – Down Year-on-Year 38,491 (-76.9%)
A life-long and avid gamer, William D'Angelo was first introduced to VGChartz in 2007. After years of supporting the site, he was brought on in 2010 as a junior analyst, working his way up to lead analyst in 2012. He has expanded his involvement in the gaming community by producing content on his own YouTube channel and Twitch channel dedicated to gaming Let's Plays and tutorials. You can contact the author at wdangelo@vgchartz.com or on Twitter @TrunksWD.
More Articles

So far, Switch is the only Winner.

Good numbers for Ps4 full price.

I think you pulled week 7 data for all of the previous years instead of week 6. I'm seeing 500k+ jumps for PS4, a 400k+ one for Switch, and 200k+ ones for Xbox One.


Showing the market share of 3DS vs Vita is just cruel at this point.


 Essay Pro