


2011 Year on Year Sales and Market Share Update to August 6th - News
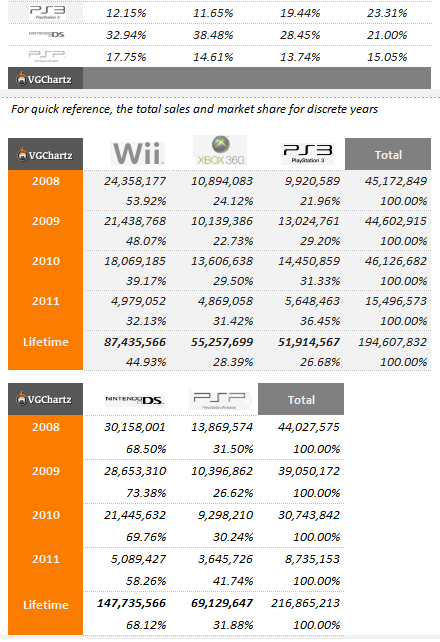
by Miles Taven , posted on 14 August 2011 / 5,916 ViewsHere we see data representing the global sales through to consumers and change in sales performance of the three home consoles over comparable periods for 2008, 2009, 2010 and 2011. Also shown is the market share for each of the consoles over the same periods.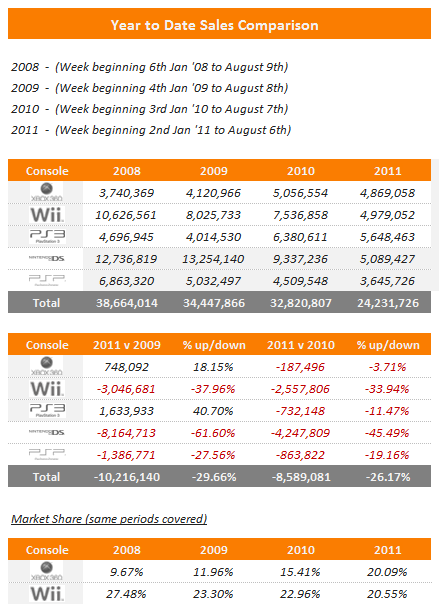
"Year to date" sales for 2008, 2009, 2010 and 2011 sales are shown in series at the top of the table and then just below a comparison of 2011 versus 2009 and 2011 versus 2010 is displayed. This provides an easy-to-view summary of all the data.
Microsoft
Xbox 360 - Down YOY 83k, Down YTD 3.71%
Sony
Playstation 3 - Down 40k, Down YTD 11.47%
Playstation Portable - Down YOY 27k, Down YTD 19.16%
Nintendo
Nintendo Wii - Down YOY 41k, Down YTD 33.94%
Nintendo DS - Down YOY 173k, Down YTD 45.49%
More Articles

Still amazes me just how much the Wii has fallen. Even when compared to last Year... 2.6 Million down on last Year already. 5.6 Million (!!!!!) down on 2008.
In a way though, it's deserved.

Given the 3DS price cut, next week might not be as boring. Maybe.

PS3 doing good market-share wise.

Wii will do about 12M this year I reckon or maybe 13M if lucky, the others to do 15M+

What a weird year this has been.
It's just the after-affect of dominating for so long. It was inevitable. I actually surprised the Wii is holding so well given how freakin' many machine there already are out there no doubt still working fine. (Not a lot of need to replace them...)