


2013 Year on Year Sales and Market Share Update to May 18th - News
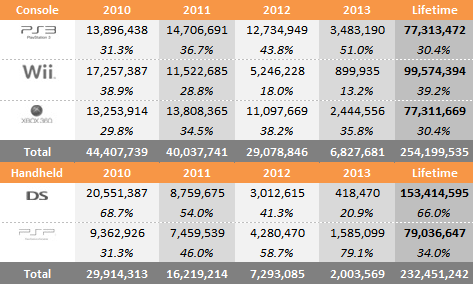
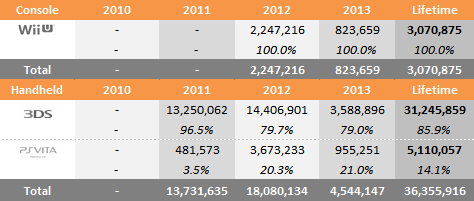
by William D'Angelo , posted on 28 May 2013 / 35,080 ViewsHere we see data representing the global sales through to consumers and change in sales performance of the four home consoles and four handhelds over comparable periods for 2010, 2011, 2012 and 2013. Also shown is the market share for each of the consoles over the same periods.
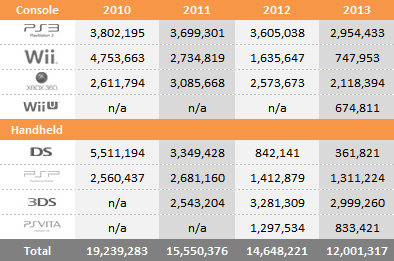
Year to Date Sales Comparison (Same Periods Covered)
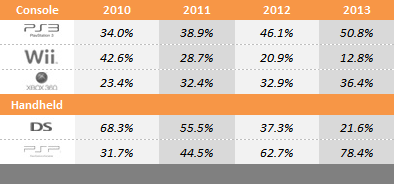
Market Share – 7th Generation (Same Periods Covered)
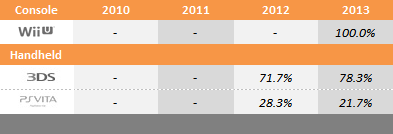
Market Share – 8th Generation (Same Periods Covered)
2010 – (Week beginning January 3 to May 22)
2011 – (Week beginning January 2 to May 21)
2012 – (Week beginning January 1 to May 19)
2013 – (Week beginning December 30 to May 18)
Total Sales and Market Share for Each Year – 7th Generation
Total Sales and Market Share for Each Year – 8th Generation
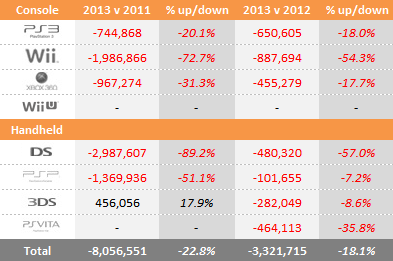
"Year to date" sales for 2010, 2011, 2012 and 2013 sales are shown in series at the top of the table and then just below a comparison of 2013 versus 2011 and 2013 versus 2012 is displayed. This provides an easy-to-view summary of all the data.
Microsoft
Xbox 360 - Down Year-on-Year 16,339, Year to Date -17.7%
Sony
PlayStation 3 – Down Year-on-Year 4,762, Year to Date -18.0%
PSP - Down Year-on-Year 5,100, Year to Date -7.2%
PlayStation Vita – Down Year-on-Year 11,145, Year to Date -35.8%
Nintendo
Nintendo Wii - Down Year-on-Year 29,365, Year to Date -54.3%
Nintendo DS - Down Year-on-Year 27,033, Year to Date -57.0%
Nintendo 3DS - Up Year-on-Year 13,231, Year to Date -8.6%
Nintendo Wii U – n/a
Contact VGChartz at wdangelo@vgchartz.com
More Articles
Table 1 and table 5 do not match at all in 2013 sales data

3DS is now selling better on a weekly basis YoY. That $80 in fall 2011 had it's effect, and now we can expect 3DS sales to grow. I wonder how much of a boost Pokemon alone will give.

PS3 has just passed X360. Now I'm wondering whether PS3's column will appear at the middle of the chart in the site's home page.

expected.


 Essay Pro