


2013 Year on Year Sales and Market Share Update to April 6th - News
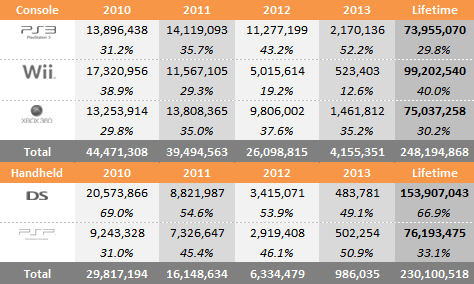
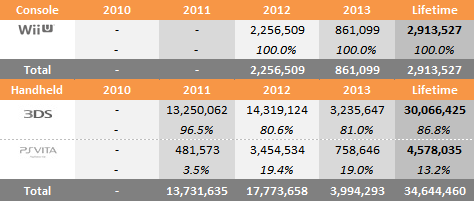
by William D'Angelo , posted on 12 April 2013 / 7,194 ViewsHere we see data representing the global sales through to consumers and change in sales performance of the four home consoles and four handhelds over comparable periods for 2010, 2011, 2012 and 2013. Also shown is the market share for each of the consoles over the same periods.
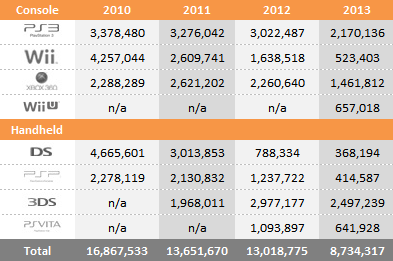
Year to Date Sales Comparison (Same Periods Covered)
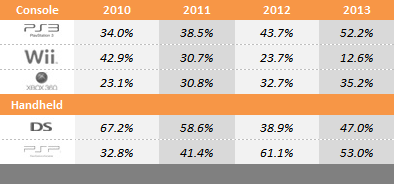
Market Share – 7th Generation (Same Periods Covered)
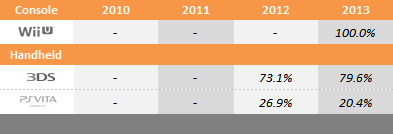
Market Share – 8th Generation (Same Periods Covered)
2010 – (Week beginning January 3 to April 10)
2011 – (Week beginning January 2 to April 9)
2012 – (Week beginning January 1 to April 7)
2013 – (Week beginning December 30 to April 6)
Total Sales and Market Share for Each Year – 7th Generation
Total Sales and Market Share for Each Year – 8th Generation
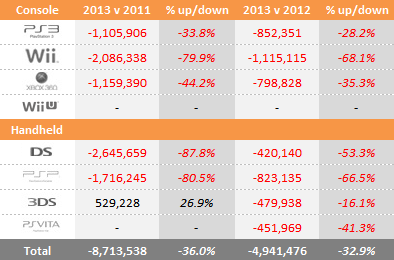
"Year to date" sales for 2010, 2011, 2012 and 2013 sales are shown in series at the top of the table and then just below a comparison of 2013 versus 2011 and 2013 versus 2012 is displayed. This provides an easy-to-view summary of all the data.
Microsoft
Xbox 360 - Down Year-on-Year 70,217, Year to Date -35.3%
Sony
PlayStation 3 – Down Year-on-Year 52,751, Year to Date -28.2%
PSP - Down Year-on-Year 53,164, Year to Date -66.5%
PlayStation Vita – Down Year-on-Year 20,551, Year to Date 41.3%
Nintendo
Nintendo Wii - Down Year-on-Year 59,469, Year to Date -68.1%
Nintendo DS - Down Year-on-Year 32,383, Year to Date -53.3%
Nintendo 3DS - Down Year-on-Year 56,578, Year to Date -16.1%
Nintendo Wii U – n/a
Contact VGChartz at wdangelo@vgchartz.com
More Articles

All swimming in red ink. :(

Down, down, down, down... everyone is down !1

not WiiU!
You would think William D'Angelo would be able to use a calculator for lifetime calculations....
Please... just use a calculator and add up (for example) WiiU sales for 2012-2013... please.... Taken the last number of each... 9+9, there is no way the lifetime can end in a 7.... and check your 3DS and Vita lifetime as well... Vita... 3+4+6 does not equal an ending number of 5.... it would end in a 3
2,256,509 + 861,099 = 3,117,608 and the Vita lifetime would then be 4,694,753 and not 4,578,035

ooo the 360 to PS3 gap is down to 1.08 million, I wonder if PS3 can top 360 this year.

in 5 months it will.

not if they drop the price
360 VS PS3 sales=N+1 selling years VS N selling years

Looks like a good time for some new hardware.