


2014 Year on Year Sales and Market Share Update to February 1st - News
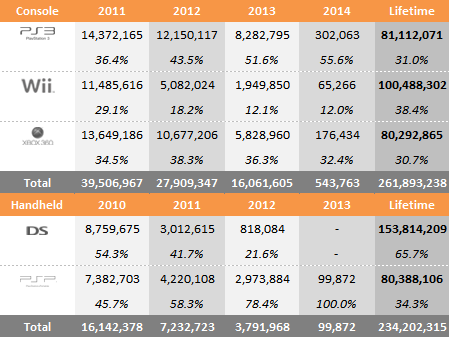
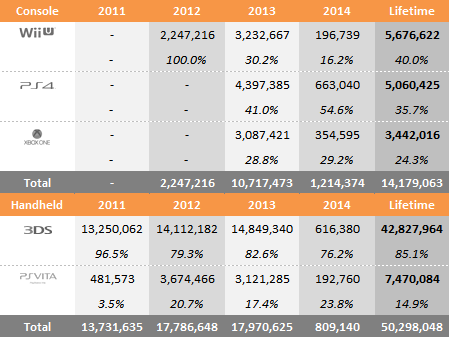
by William D'Angelo , posted on 13 February 2014 / 8,940 ViewsHere we see data representing the global sales through to consumers and change in sales performance of the four home consoles and four handhelds over comparable periods for 2010, 2011, 2012 and 2013. Also shown is the market share for each of the consoles over the same periods.
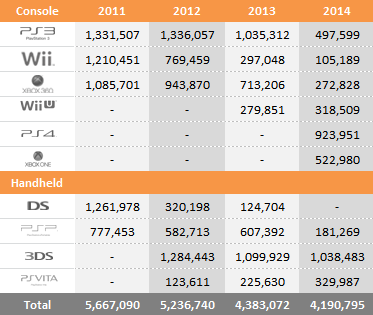
Year to Date Sales Comparison (Same Periods Covered)
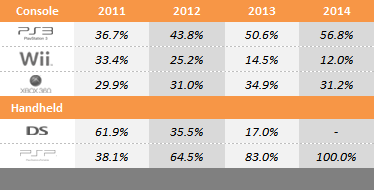
Market Share – 7th Generation (Same Periods Covered)
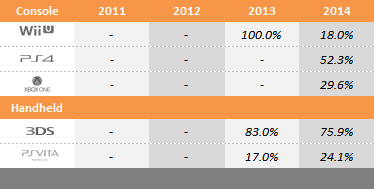
Market Share – 8th Generation (Same Periods Covered)
2011 – (Week beginning January 2 to February 5)
2012 – (Week beginning January 1 to February 4)
2013 – (Week beginning December 30 to February 2)
2014 – (Week beginning December 29 to February 1)
Total Sales and Market Share for Each Year – 7th Generation
Total Sales and Market Share for Each Year – 8th Generation
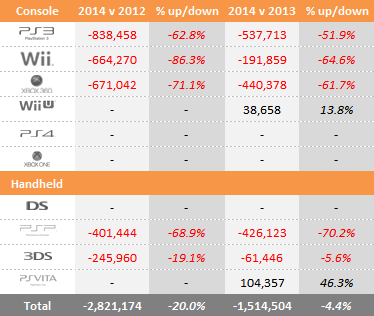
"Year to date" sales for 2010, 2011, 2012 and 2013 sales are shown in series at the top of the table and then just below a comparison of 2013 versus 2011 and 2013 versus 2012 is displayed. This provides an easy-to-view summary of all the data.
Microsoft
Xbox 360 - Down Year-on-Year 80,827, Year to Date -61.7%
Xbox One – n/a
Sony
PlayStation 3 – Down Year-on-Year 101,657, Year to Date -51.9%
PSP - Down Year-on-Year 3,159, Year to Date -70.2%
PlayStation Vita – Up Year-on-year 10,430, Year to Date 46.3%
PlayStation 4 – n/a
Nintendo
Nintendo Wii - Down Year-on-Year 27,982, Year to Date -64.6%
Nintendo 3DS – Down Year-on-Year 12,915, Year to Date -5.6%
Nintendo Wii U – Up Year-on-Year 12,029, Year to Date 46.3%
________________________________________________________________________________________
A life-long and avid gamer, William D'Angelo was first introduced to VGChartz in 2007. After years of supporting the site, he was brought on in 2010 as a junior analyst, working his way up to lead analyst in 2012. He has expanded his involvement in the gaming community by producing content on his own YouTube channel dedicated to gaming Let's Plays and tutorials. Outside, in the real world, he has a passion for the outdoors which includes everything from hiking to having received his B.A. in Environmental Studies. You can contact the author at wdangelo@vgchartz.com.
More Articles

March-May will be interesting. I think in terms of sales boosting power Mario Kart > Titanfall > InFamous, but currently the PS4 > XBO > WiiU in terms of sales. Could even out the playing field.
For me, this is will sell the console on 31 March:
PS4=6,7 milion
Wii U=6,6 milion
XO=4,1 milion
...
But for Wii U could announce the new title on direct tonicgth (Yoshi, Zelda H.W, Megami X Fire Emlend) for March, if they do, Wii U sold 7 milion.
Yes, i'm serious. :)

It´s astonishing to see how the console market continues to fall year after year. From 5,6 millions in 2011 to 4,1 millions in 2014 in total. Home console fell from 3,5 millions to 2,5 millions, handhelds from 2 millions to 1,4 millions. And this considering only the first 5 weeks.

Vita and Wii U domination :-)
Wii U sold 5,86 milion on 26 Gen for Nintendo.
VGC estimate 5,62...
The Wii U sold 240k more VGC total.
So, Wii U:
5,67 + 0,24= 5,91 milion of Wii U.
Then:
Wii U=5,91 milion
PS4= 5,05 milion
XO=3,44 milion
Those are Nintendo shipment numbers the ones sitting gathering dust on shelves.


 Essay Pro