


2012 Year on Year Sales and Market Share Update to December 15th - News
by William D'Angelo , posted on 23 December 2012 / 22,497 ViewsHere we see data representing the global sales through to consumers and change in sales performance of the three home consoles over comparable periods for 2009, 2010, 2011 and 2012. Also shown is the market share for each of the consoles over the same periods.
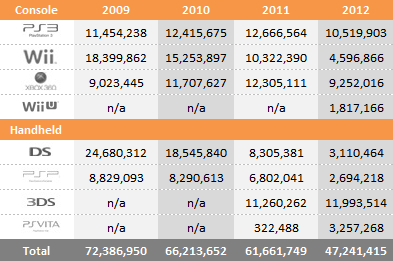
Year to Date Sales Comparison (Same Periods Covered)

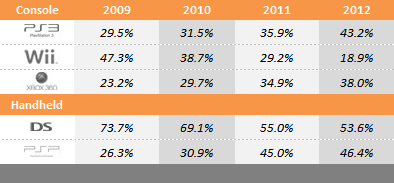
Market Share – 7th Generation (Same Periods Covered)
Market Share – 8th Generation (Same Periods Covered)

2009 – (Week beginning January 4 to December 19)
2010 – (Week beginning January 3 to December 18)
2011 – (Week beginning January 2 to December 17)
2012 – (Week beginning January 1 to December 15)
Total Sales and Market Share for Each Year – 7th Generation
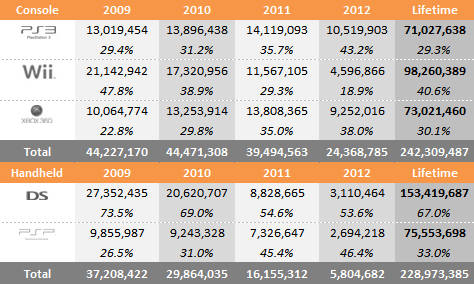
Total Sales and Market Share for Each Year – 8th Generation

"Year to date" sales for 2009, 2010, 2011 and 2012 sales are shown in series at the top of the table and then just below a comparison of 2012 versus 2010 and 2012 versus 2011 is displayed. This provides an easy-to-view summary of all the data.
Microsoft
Xbox 360 - Down Year-on-Year 231,839, Year to Date -24.8%
Sony
PlayStation 3 – Down Year-on-Year 119,131, Year to Date -16.9%
PSP - Down Year-on-Year 167,977, Year to Date -60.4%
PlayStation Vita – Down Year-on-Year 151,269, Year to Date 910%
Nintendo
Nintendo Wii - Down Year-on-Year 479,054, Year to Date -55.5%
Nintendo DS - Down Year-on-Year 119,131, Year to Date -62.5%
Nintendo 3DS - Down Year-on-Year 348,788, Year to Date 6.5%
Nintendo Wii U – n/a
Contact VGChartz at wdangelo@vgchartz.com
More Articles

3DS will be the best selling handheld and PS3 will be the best selling console this year!
:D

Thumbing him down won't make it false.

Whoah DS only sold 211k lifetime? PSP only did 77k. WOW

nice to see PS3 declining slower then 360, but both remain high/show growth in their strongest markets. PS3 just may have 50% market share next yr. and if Sony plays their card right, PS3 could make it a 300-600k gap between 360 and PS3, but yr., end 2013.

Ps3 has outsold the 360 every year since 2009. Interesting. Also very weird that 360 in down almost 3 million from 2011 to 2012. IMO Halo 4 is a much better game and system seller than Gears 3. Both CODS from 11 and 12 offset each other. What else released in 2011 that was so big??
3ds numbers are just huge. Vita needs to do something fast to attract the mainstream audience.
wow
Sony can't afford another price cut. It just released the Super Slim and did a price cut last year. 360 has been price cut free since what 2009? or 2008? Like DS, PSP, and Wii before them, the HD twins sales will drop hard in the next 2 years with the announce and release of next gen hardware.


 Essay Pro