


2012 Year on Year Sales and Market Share Update to October 13th - News
by William D'Angelo , posted on 20 October 2012 / 10,254 ViewsHere we see data representing the global sales through to consumers and change in sales performance of the three home consoles over comparable periods for 2009, 2010, 2011 and 2012. Also shown is the market share for each of the consoles over the same periods.
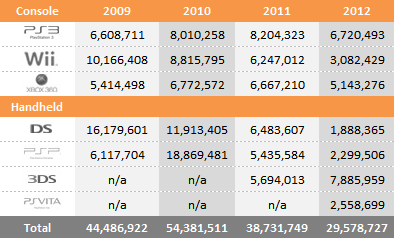
Year to Date Sales Comparison (Same Periods Covered)
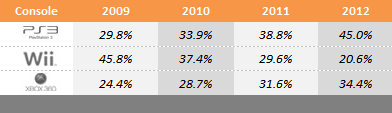
Market Share (Same Periods Covered)


2009 – (Week beginning January 4 to October 17)
2010 – (Week beginning January 3 to October 16)
2011 – (Week beginning January 2 to October 15)
2012 – (Week beginning January 1 to October 13)
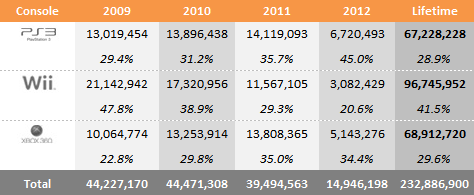
Total Sales and Market Share for Each Year


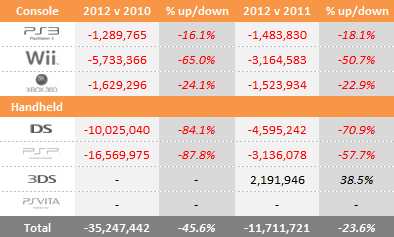
"Year to date" sales for 2009, 2010, 2011 and 2012 sales are shown in series at the top of the table and then just below a comparison of 2012 versus 2010 and 2012 versus 2011 is displayed. This provides an easy-to-view summary of all the data.
Microsoft
Xbox 360 - Down Year-on-Year 35,965, Year to Date -22.9%
Sony
PlayStation 3 – Down Year-on-Year 5,699, Year to Date -18.1%
PSP - Down Year-on-Year 55,974, Year to Date -57.7%
PlayStation Vita - n/a
Nintendo
Nintendo Wii - Down Year-on-Year 102,712, Year to Date -50.7%
Nintendo DS - Down Year-on-Year 44,996, Year to Date -70.9%
Nintendo 3DS - Up Year-on-Year 21,539, Year to Date 38.5%
Contact VGChartz at wdangelo@vgchartz.com
More Articles

PS3 with the same lead as last year but all 3 consoles are down so the number is much more likely to stay. Also the Kinect fad has worn off a bit so it looks like PS3 will take 2012 with the new slim and even a possible price cut coming.

I agree, last year MS managed to reduce the gap to 100k, and although the gap is the same, the overall sales are less for both the PS3 and the 360. Thus percentage-wise the gap is larger, and I don't think Halo will be enough to reduce it. If anything Wii U will hurt 360 and PS3 sales this fall, freezing the gap between the PS3 and 360 at 1-1.5 million.
Pretty amazing to think there was ever a year PSP sold 18 million before the holidays. Never knew 2010 was so big for it. Vita needs to find that killer app that can make it that successful at some point.

That must be a mistake the total sales for 2010 were 9,243,328, i think sony would be more than happy with this number though for the Vita


 Essay Pro