
Year on Year Sales & Market Share Charts - June 9, 2018 - Sales
by William D'Angelo , posted on 01 July 2018 / 5,303 ViewsHere we see data representing the global sales through to consumers and change in sales performance of the four home consoles and four handhelds over comparable periods for 2015, 2016, 2017, and 2018. Also shown is the market share for each of the consoles over the same periods.
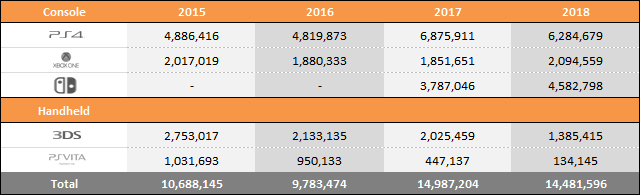
Year to Date Sales Comparison (Same Periods Covered)

Market Share (Same Periods Covered)
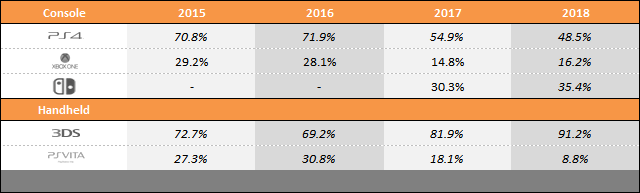
2015 – (Week ending January 10 to June 13)
2016 – (Week ending January 9 to June 11)
2017 – (Week ending January 7 to June 10)
2018 – (Week ending January 6 to June 9)
Total Sales and Market Share for Each Year
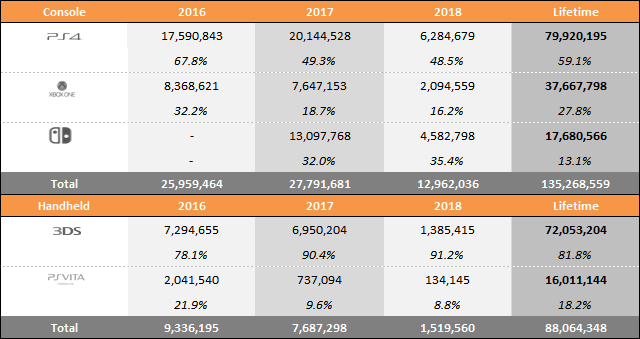
"Year to date" sales for 2015, 2016, 2017, and 2018 sales are shown in series at the top of the table and then just below a comparison of 2018 versus 2017 and 2018 versus 2016 is displayed. This provides an easy-to-view summary of all the data.
Microsoft
- Xbox One – Up Year-on-Year 242,908 (13.1%)
Nintendo
- Nintendo Switch - Up Year-on-Year 795,752 (21.0%)
- Nintendo 3DS – Down Year-on-Year 640,044 (-31.6%)
Sony
- PlayStation 4 – Down Year-on-Year 591,232 (-8.6%)
- PlayStation Vita – Down Year-on-Year 312,992 (-70.0%)
A life-long and avid gamer, William D'Angelo was first introduced to VGChartz in 2007. After years of supporting the site, he was brought on in 2010 as a junior analyst, working his way up to lead analyst in 2012. He has expanded his involvement in the gaming community by producing content on his own YouTube channel and Twitch channel dedicated to gaming Let's Plays and tutorials. You can contact the author at wdangelo@vgchartz.com or on Twitter @TrunksWD.
More Articles

PS4 gonna reach 100m next year. Crazy

I'm juste asking myself why the numbers frome the Global hardware 9th of June are not exactly added here?
I'll explain:
On the "Year on Year Sales & Market Share Charts - June 2, 2018 - Sales" Switch had 4'440'442 Units
On the Global hardware 9th of June Switch had 176'356 Units
4'440'442 + 176'356 = 4'616'798
But here it's only 4'582'798. There's a difference of 34'000 units.
it's the same with PS4 and Xone.
Can someone explain it to me? Just to make sure I understand how this works. Thanks!

There had been some adjustments between both postings, namely all 3 consoles were adjusted down a notch after the NPD results got leaked. Pretty sure the discrepancy comes from that adjustment.