


2012 Year on Year Sales and Market Share Update to December 8th - News
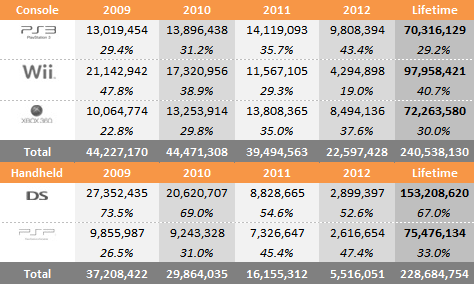
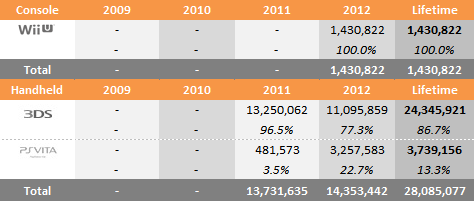
by William D'Angelo , posted on 14 December 2012 / 11,005 ViewsHere we see data representing the global sales through to consumers and change in sales performance of the three home consoles over comparable periods for 2009, 2010, 2011 and 2012. Also shown is the market share for each of the consoles over the same periods.
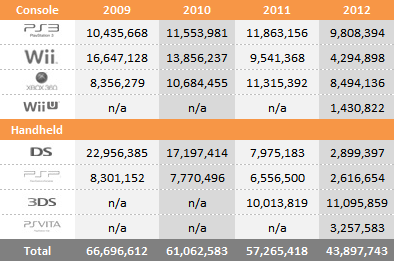
Year to Date Sales Comparison (Same Periods Covered)
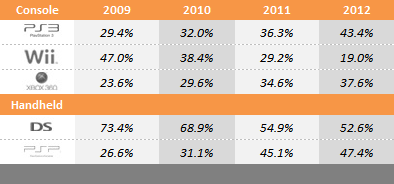
Market Share – 7th Generation (Same Periods Covered)
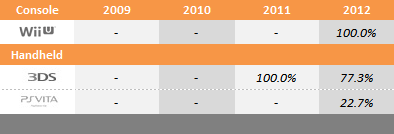
Market Share – 8th Generation (Same Periods Covered)
2009 – (Week beginning January 4 to December 12)
2010 – (Week beginning January 3 to December 11)
2011 – (Week beginning January 2 to December 10)
2012 – (Week beginning January 1 to December 8)
Total Sales and Market Share for Each Year – 7th Generation
Total Sales and Market Share for Each Year – 8th Generation
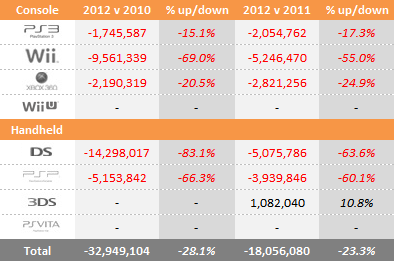
"Year to date" sales for 2009, 2010, 2011 and 2012 sales are shown in series at the top of the table and then just below a comparison of 2012 versus 2010 and 2012 versus 2011 is displayed. This provides an easy-to-view summary of all the data.
Microsoft
Xbox 360 - Down Year-on-Year 208,171, Year to Date -24.9%
Sony
PlayStation 3 – Down Year-on-Year 61,268, Year to Date -17.3%
PSP - Down Year-on-Year 155,120, Year to Date -60.1%
PlayStation Vita - n/a
Nintendo
Nintendo Wii - Down Year-on-Year 396,959, Year to Date -55.0%
Nintendo DS - Down Year-on-Year 109,672, Year to Date -63.6%
Nintendo 3DS - Down Year-on-Year 402,208, Year to Date 10.8%
Nintendo Wii U – n/a
Contact VGChartz at wdangelo@vgchartz.com
More Articles

3DS isn't doing that great this year. Weekly 3DS sales last year were at about 1 million at this point, this year only 700k. Nintendo really needed more then just Paper Mario this fall.

well they had 3d mario and Kart last year. I feel like those will be 2 of the systems top 5 games for its whole lifetime (Pokemon will be #1)

Seriously. At this rate, 3DS might even be down YOY at the end.
Wii U looks like it will top PSP this year, maybe with luck PSV as well. Not bad for 5 or 6 weeks.

the comparrison/decline is the most interesting part. PS3 has a 1.4m unit lead over 360, that it will likel keep. Vita WiiU and 3ds should finish strong.
3DS is currently seeing the lag from not having SM3D and MK7 this year as it has declined from last year's holiday. WiiU will finish strong I agree. Vita hasn't looked strong at all other than a decent BF (only when looking at it in context). I hope you're right as I don't want ipads to take over but both handhelds are looking shaky (obviously Vita is doing 100x worse than 3DS which is ok despite decline)
ah 2009 so full of promise...then Kinect came...

LMAO!! Pezus how much does Sony pay you to make bad news sound good?


 Essay Pro