PS5 vs Switch Sales Comparison - October 2021 - Sales
by William D'Angelo , posted on 27 November 2021 / 3,653 ViewsThe VGChartz sales comparison series of articles are updated monthly and each one focuses on a different sales comparison using our estimated video game hardware figures. The charts include comparisons between the PlayStation 5, Xbox Series X|S, and Nintendo Switch, as well as with older platforms. There are articles based on our worldwide estimates, as well as the US, Europe, and Japan.
This monthly series compares the aligned worldwide sales of the PlayStation 5 and Switch.
The PlayStation 5 launched in November 2020, while the Nintendo Switch launched in March 2017. This does mean the holiday periods for the two consoles do not lineup.


PS5 Vs. Switch Worldwide:
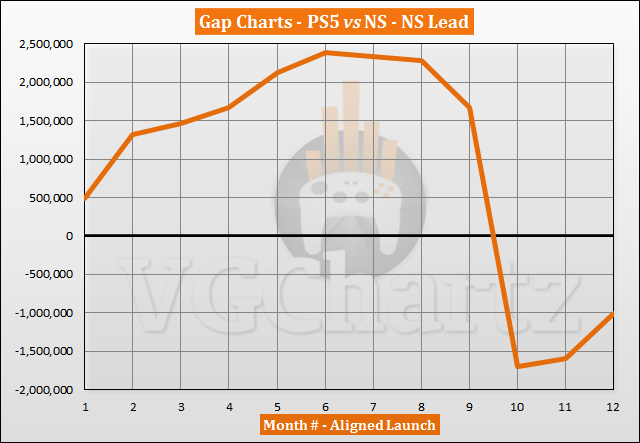
Gap change in latest month: 581,658 - PS5
Total Lead: 1,012,236 - NS
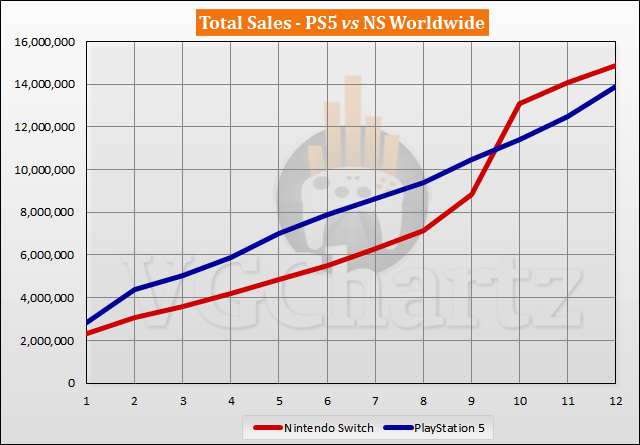
PlayStation 5 Total Sales: 13,869,005
Switch Total Sales: 14,881,241
October 2021 is the 12th month the PlayStation 5 has been available for. In the latest month, the gap grew in favor of the PlayStation 5 when compared to the aligned launch of the Nintendo Switch by 581,658 units. The Nintendo Switch is ahead of the PlayStation 5 by 1.01 million units.
The PlayStation 5 has sold 13.87 million units in 12 months, while the Nintendo Switch sold 14.88 million units. Month 12 for the PlayStation 5 is October 2021 and for the Nintendo Switch it is February 2018.
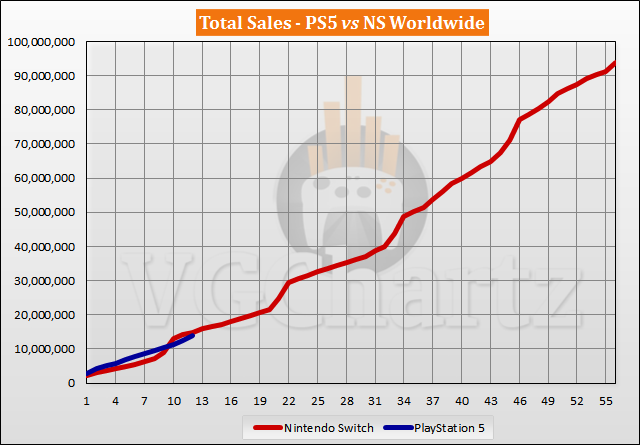
The Nintendo Switch crossed 20 million units sold in month 19, 30 million in month 23, and 40 million in month 33. The Nintendo Switch has sold 93.70 million units through October 2021.
A life-long and avid gamer, William D'Angelo was first introduced to VGChartz in 2007. After years of supporting the site, he was brought on in 2010 as a junior analyst, working his way up to lead analyst in 2012. He has expanded his involvement in the gaming community by producing content on his own YouTube channel and Twitch channel dedicated to gaming Let's Plays and tutorials. You can contact the author at wdangelo@vgchartz.com or on Twitter @TrunksWD.
More Articles
I think it should be "PS5 lead" in the first graph
The graph is in the negative, that means Switch lead.
The interpratation I get from that graph with NS Lead in the tittle is: at 12 month, the Switch lead is around -1,000,000. So I'd assume that Switch is behind PS5 by around 1,000,000 which isn't the case. If the title were "PS5 Lead", the tittle would match the info in the graph
I think the "NS lead" is the interpretation of "PS5 vs NS" graph, not the title itself.
Really? I'd have never though that. If it was "NS leads", maybe I would. When I see "NS lead" in the tittle of the graph I imagine that this graph consists of a subtraction between Switch and PS5 numbers (Switch - PS5), that can result in a positive lead or a "negative lead". Why is this the only graph with the interpretation of its information stated in the tittle?
The graph shows the PS5 sales relative to the Switch sales.
Like you, I was surprised at the negative. Then looked at how it was PS5 vs NS, and realized it must be from the perspective of the PS5. So I agree that the article is correct, but I also agree with you that it's not going to be obvious to everyone (it wasn't obvious to me!).
I'm very curious to see if Switch non-holiday sales can retain their lead over PS5 holiday sales with a heavy shortage.
I doubt that.
Agreed. PS5 is pretty much guaranteed to overtake Switch unless the stock issues get even worse.
it'll pretty much be similar to NS vs PS4, with the switch overtaking ps5 during the switch's holidays and ps5 overtaking switch during non-holidays and ps5 holidays.
That's what I'm thinking. It'll be interesting to see if the shortage has any effect though.


 Essay Pro