


Year on Year Sales & Market Share Charts - July 20, 2019 - Sales
by William D'Angelo , posted on 02 August 2019 / 3,705 ViewsHere we see data representing the global sales through to consumers and change in sales performance of the four home consoles and four handhelds over comparable periods for 2015, 2016, 2017, and 2018. Also shown is the market share for each of the consoles over the same periods.
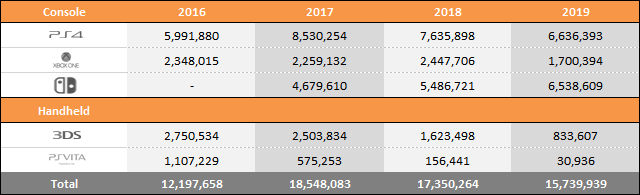
Year to Date Sales Comparison (Same Periods Covered)
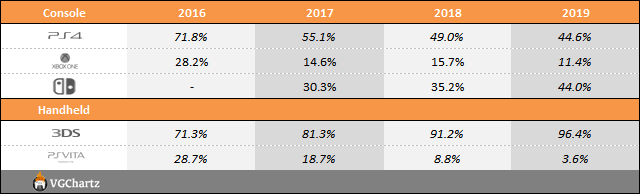
Market Share (Same Periods Covered)
2016 – (Week ending January 9 to July 24)
2017 – (Week ending January 7 to July 22)
2018 – (Week ending January 6 to July 21)
2018 – (Week ending January 5 to July 20)
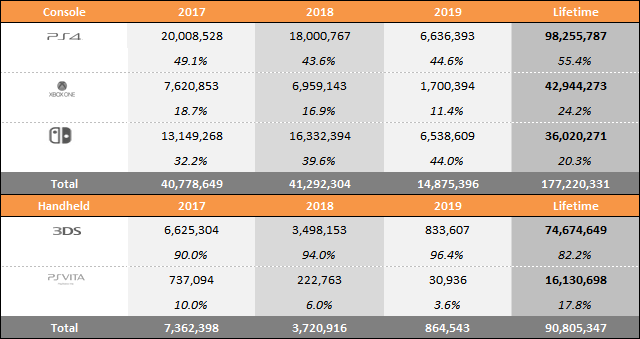
Total Sales and Market Share for Each Year
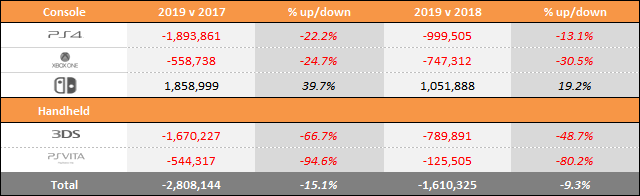
"Year to date" sales for 2016, 2017, 2018, and 2019 sales are shown in series at the top of the table and then just below a comparison of 2019 versus 2018 and 2018 versus 2017 is displayed. This provides an easy-to-view summary of all the data.
Microsoft
- Xbox One – Down Year-on-Year 747,312 (-30.5%)
Nintendo
- Nintendo Switch - Up Year-on-Year 1,051,888 (19.2%)
- Nintendo 3DS – Down Year-on-Year 789,891 (-48.7%)
Sony
- PlayStation 4 – Down Year-on-Year 999,505 (-13.1%)
- PlayStation Vita – Down Year-on-Year 125,505 (-80.2%)
A life-long and avid gamer, William D'Angelo was first introduced to VGChartz in 2007. After years of supporting the site, he was brought on in 2010 as a junior analyst, working his way up to lead analyst in 2012. He has expanded his involvement in the gaming community by producing content on his own YouTube channel and Twitch channel dedicated to gaming Let's Plays and tutorials. You can contact the author at wdangelo@vgchartz.com or on Twitter @TrunksWD.
More Articles

PS4 still leading the way in its 6th year. Amazing!

Where are the game sales charts? I loved them.

They are not published anymore because the possible estimation was becoming more and more irrelevant with now more than 35% of the game sales being from download, and these sales are not trackable. So VGCHARTZ only now publishes confirmed sales data from games publishers.
But are they only doing rough projection from Japanese data which are the only available one ? I start to wonder know if we should consider a tolerance of +/-10% or +/-20% in every HW estimation published. Still weird that we have around 3 millions of PS4 on transit and only 1,8 for the Switch.


 Essay Pro