


2013 Year on Year Sales and Market Share Update to August 31st - News
by William D'Angelo , posted on 09 September 2013 / 7,120 ViewsHere we see data representing the global sales through to consumers and change in sales performance of the four home consoles and four handhelds over comparable periods for 2010, 2011, 2012 and 2013. Also shown is the market share for each of the consoles over the same periods.
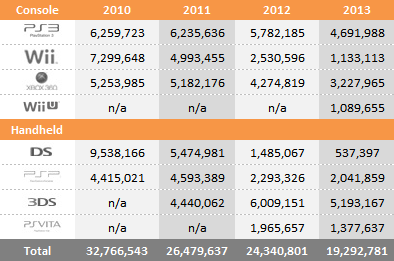
Year to Date Sales Comparison (Same Periods Covered)
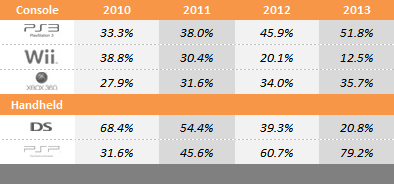
Market Share – 7th Generation (Same Periods Covered)
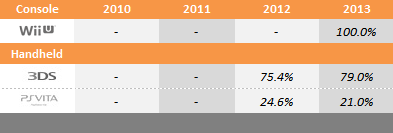
Market Share – 8th Generation (Same Periods Covered)
2010 – (Week beginning January 3 to September 4)
2011 – (Week beginning January 2 to September 3)
2012 – (Week beginning January 1 to September 1)
2013 – (Week beginning December 30 to August 31)
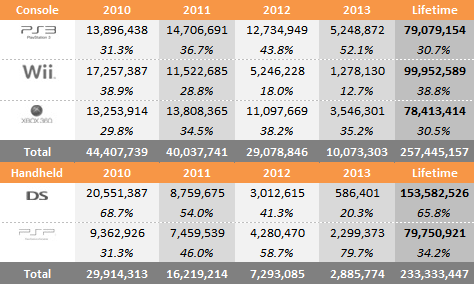
Total Sales and Market Share for Each Year – 7th Generation
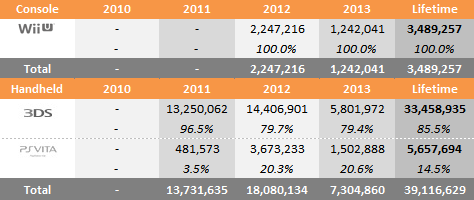
Total Sales and Market Share for Each Year – 8th Generation
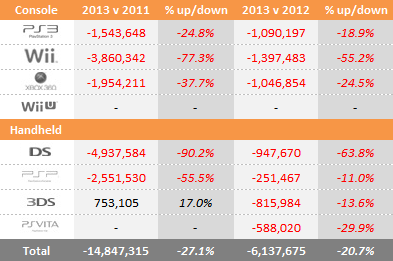
"Year to date" sales for 2010, 2011, 2012 and 2013 sales are shown in series at the top of the table and then just below a comparison of 2013 versus 2011 and 2013 versus 2012 is displayed. This provides an easy-to-view summary of all the data.
Microsoft
Xbox 360 - Down Year-on-Year 33,852, Year to Date -24.5%
Sony
PlayStation 3 – Up Year-on-Year 18,523, Year to Date -18.9%
PSP - Down Year-on-Year 16,369, Year to Date -11.0%
PlayStation Vita – Down Year-on-year 49,247, Year to Date -29.9%
Nintendo
Nintendo Wii - Down Year-on-Year 28,845, Year to Date -55.2%
Nintendo DS - Down Year-on-Year 86,559, Year to Date -63.8%
Nintendo 3DS - Down Year-on-Year 86,559, Year to Date -13.6%
Nintendo Wii U – n/a
Contact VGChartz at wdangelo@vgchartz.com


 Essay Pro