


2012 Year on Year Sales and Market Share Update to May 26th - News
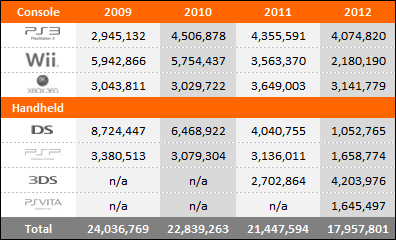
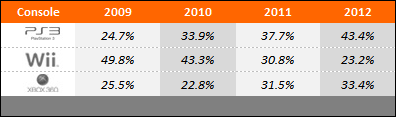
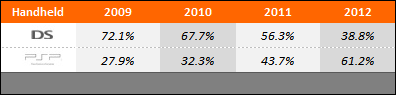
by William D'Angelo , posted on 03 June 2012 / 7,777 ViewsHere we see data representing the global sales through to consumers and change in sales performance of the three home consoles over comparable periods for 2009, 2010, 2011 and 2012. Also shown is the market share for each of the consoles over the same periods.
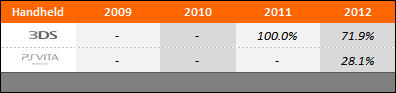
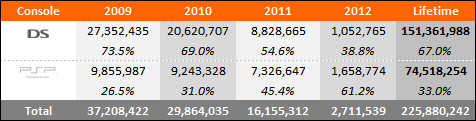
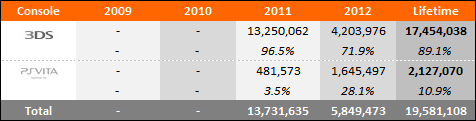
Year to Date Sales Comparison (Same Periods Covered)
Market Share (Same Periods Covered)
2009 – (Week beginning January 4 to May 30)
2010 – (Week beginning January 3 to May 29)
2011 – (Week beginning January 2 to May 28)
2012 – (Week beginning January 1 to May 26)
Total Sales and Market Share for Each Year
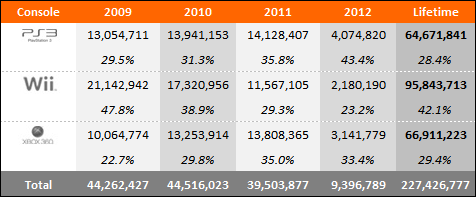
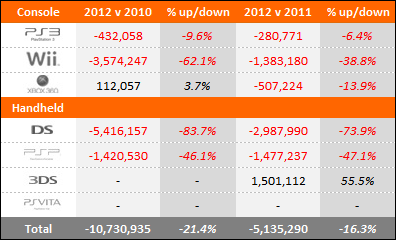
"Year to date" sales for 2009, 2010, 2011 and 2012 sales are shown in series at the top of the table and then just below a comparison of 2012 versus 2010 and 2012 versus 2011 is displayed. This provides an easy-to-view summary of all the data.
Microsoft
Xbox 360 - Down Year-on-Year 15k, Year to Date -13.9%
Sony
PlayStation 3 - Down Year-on-Year 1k, Year to Date -6.4%
PlayStation Vita - n/a
Nintendo
Nintendo Wii - Down Year-on-Year 171k, Year to Date -368.8%
Nintendo 3DS - Up Year-on-Year 463k, Year to Date 55.5%
Contact VGChartz at wdangelo@vgchartz.com


 Essay Pro