
PS5 vs PS4 Sales Comparison in Japan - December 2022 - Sales
by William D'Angelo , posted on 03 February 2023 / 6,992 ViewsThe VGChartz sales comparison series of articles are updated monthly and each one focuses on a different sales comparison using our estimated video game hardware figures. The charts include comparisons between the PlayStation 5, Xbox Series X|S, and Nintendo Switch, as well as with older platforms. There are articles based on our worldwide estimates, as well as the US, Europe, and Japan.
This monthly series compares the aligned Japanese sales of the PlayStation 5 and PlayStation 4.
The PlayStation 5 launched in November 2020 in Japan, while the PlayStation 4 launched in February 2014. This does mean the holiday periods for the two consoles do not lineup.
PS5 Vs. PS4 Japan:
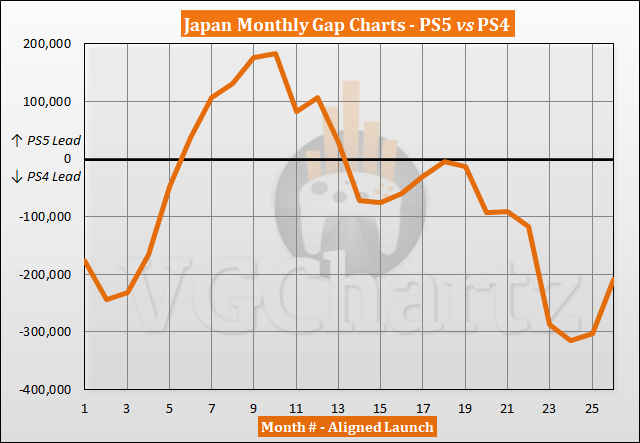
Gap change in latest month: 94,837 - PS5
Gap change over last 12 months: 135,790 - PS4
Total Lead: 208,367 - PS4
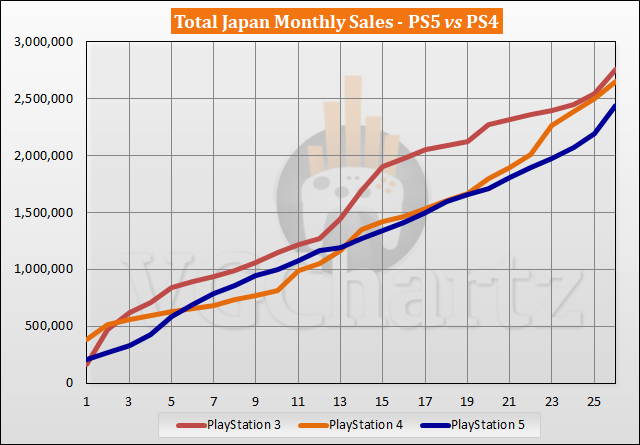
PlayStation 5 Total Sales: 2,438,004
PlayStation 4 Total Sales: 2,646,371
December 2022 is the 26th month the PlayStation 5 has been available for. In the latest month, the gap grew in favor of the PlayStation 5 when compared to the aligned launch of the PlayStation 4 by 94,837 units.
In the last 12 months, the PS4 has outsold the PS5 by 135,790 units. The PS4 is currently ahead of the PS5 by 208,367 million units.
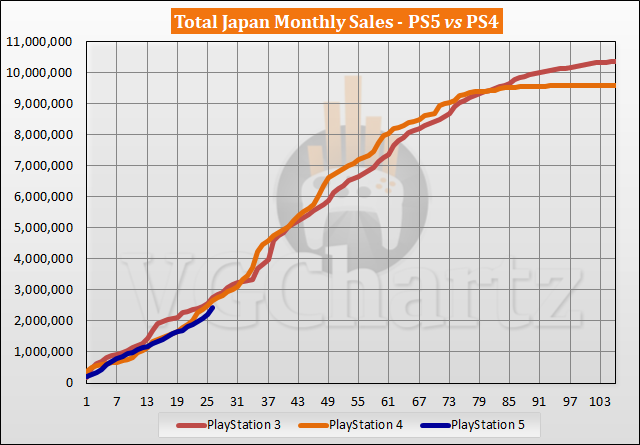
The 26th month for the PS5 in Japan is December 2022, while for the PS4 it is March 2016. The PS5 has sold 2.44 million units, while the PS4 sold 2.65 million units during the same timeframe. The PS4 sold current PS5 sales in month 25.
The PS4 crossed 3 million units in Japan in month 30, 4 million in month 35, and 5 million in month 41. The PS4 has sold 9.60 million units to date.
A life-long and avid gamer, William D'Angelo was first introduced to VGChartz in 2007. After years of supporting the site, he was brought on in 2010 as a junior analyst, working his way up to lead analyst in 2012 and taking over the hardware estimates in 2017. He has expanded his involvement in the gaming community by producing content on his own YouTube channel and Twitch channel. You can contact the author on Twitter @TrunksWD.
More Articles
PS5 wasn't able to sell as much units as PS4 in their particular holiday season. The gap chart suggests that the negative trend for PS5 continues. Next holiday season of PS3 and PS4 were their strongest, because of the launch of PS3 Slim and PS4 Pro. This will be a crucial year for PS5.
Honestly given the extended stock shortages that are just now resolving I think we need to see a few more months to make an accurate prediction. If the PS5 can maintain its current level of sales I think it will land in the same general area. The latest month shows nearly 100k advantage for the PS5. The PS4 can only withstand so a couple more of those. The chart does not indicate a negative trend. It outsold the PS4 by 94k in December.
"The gap chart suggests that the negative trend for PS5 continues."
Because the gap chart shows exactly the opposite?
If Sony can regularly ship 40k consoles, the gap will disappear in the next weeks/months.
The downward trend began in month 11. Since then we have a descending channel with lower highs and lower lows, which is likely to continue until it is invalidated with an higher high and higher low. If you draw a line on every high (200k and 0), we are currently at a resistance point. Of course I meant the long-term trend, not short-term. December was just a correction after the gap chart found a bottom at -300k, just like the previous bottom at -80k. Gap chart patterns behave like stock exchange prices and every other thing where you have supply and demand.





 Essay Pro