


Switch vs PS4 vs Xbox One Global Lifetime Sales – October 2019 - Sales
by William D'Angelo , posted on 11 November 2019 / 10,955 ViewsWelcome to the latest edition of the ‘Switch vs PS4 vs Xbox One Worldwide’ article. This series compares the monthly and lifetime retail sales of the three main consoles - the PlayStation 4, Xbox One, and Switch.
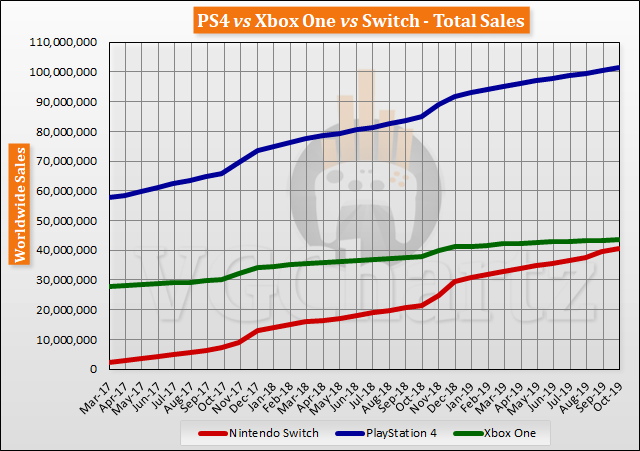
Looking at the total sales of the PlayStation 4, Xbox One, and Switch through October 2019 shows the Nintendo Switch closing the gap with the Xbox One on a monthly basis and is now less than three million units behind.
The PlayStation 4 passed the 101 million mark, and the Nintendo Switch passed the 40 million mark. The PS4 has sold 101.34 million units lifetime, the Xbox One 43.64 million units, and the Switch 40.74 million units.
Taking a look at the marketshare, the PlayStation 4 currently leads. The PlayStation 4 has a 55 percent market share, the Xbox One sits at 23 percent, and the Switch 22 percent.
PlayStation 4 Total Sales: 101,342,408
Xbox One Total Sales: 43,635,526
Switch Total Sales: 40,736,064
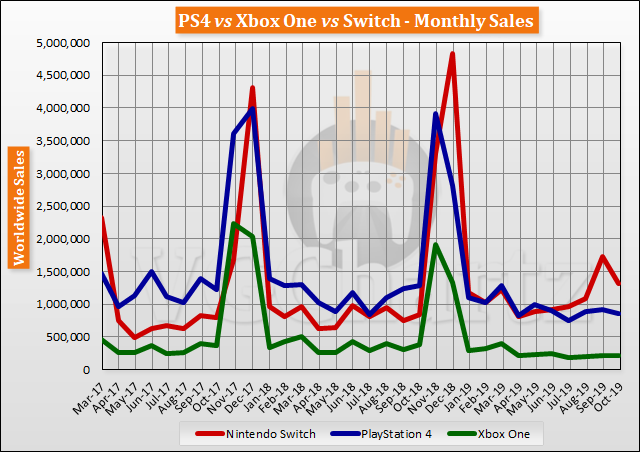
During the month of October 2019, the Switch outsold the PlayStation 4 by 467,456 units for the month and the Xbox One by 1,100,412 units. The PlayStation 4 outsold the Xbox One by 632,956 units.
When you compare monthly sales to a year ago, the Switch is up, while the PlayStation 4 and Xbox One are down. The Nintendo Switch is up 477,915 units (+56.56%), the PlayStation 4 is down 423,408 units (-33.11%) and the Xbox One is down 155,131 units (-41.08%).
Taking a look at the marketshare, the Switch managed to achieve 55 percent of the monthly sales. The PlayStation 4 accounted for 36 percent of the consoles sold, and the Xbox One just nine percent.
PlayStation 4 Monthly Sales: 855,422
Xbox One Monthly Sales: 222,466
Switch Monthly Sales: 1,322,878
The PlayStation 4 and Xbox One launched in November 2013, while the Switch launched in March 2017.
As a reminder VGChartz tracks consoles sold to consumers and not units shipped.
A life-long and avid gamer, William D'Angelo was first introduced to VGChartz in 2007. After years of supporting the site, he was brought on in 2010 as a junior analyst, working his way up to lead analyst in 2012. He has expanded his involvement in the gaming community by producing content on his own YouTube channel and Twitch channel dedicated to gaming Let's Plays and tutorials. You can contact the author at wdangelo@vgchartz.com or on Twitter @TrunksWD.
More Articles

Visually I believe that there is a mistake with the first graph. The slop of the Switch should be more intense (~1,7 times), but it has the same angle as the PS4.

Their sales graphs look similar because they sold similarly well. But if you just look at the last holiday season for instance, you can see a clear difference between Switch and PS4


 Essay Pro