


Year on Year Sales & Market Share Charts - March 30, 2019 - Sales
by William D'Angelo , posted on 14 April 2019 / 6,249 ViewsHere we see data representing the global sales through to consumers and change in sales performance of the four home consoles and four handhelds over comparable periods for 2015, 2016, 2017, and 2018. Also shown is the market share for each of the consoles over the same periods.
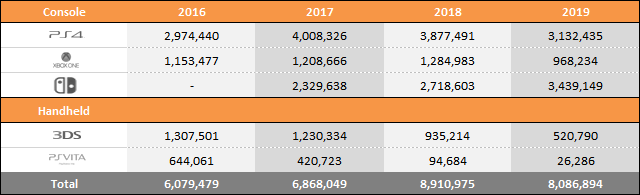
Year to Date Sales Comparison (Same Periods Covered)
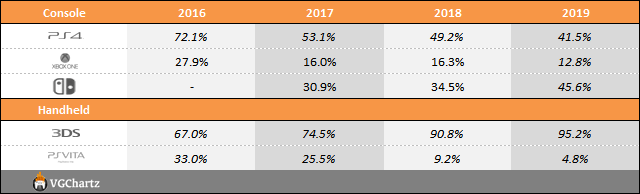
Market Share (Same Periods Covered)
2016 – (Week ending January 9 to April 3)
2017 – (Week ending January 7 to April 1)
2018 – (Week ending January 6 to March 31)
2018 – (Week ending January 5 to March 30)
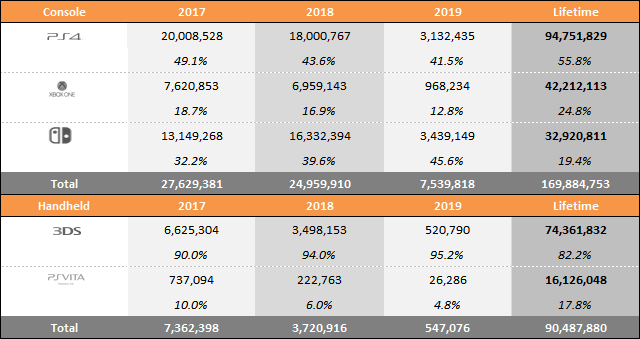
Total Sales and Market Share for Each Year
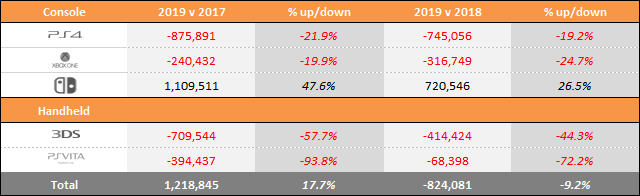
"Year to date" sales for 2016, 2017, 2018, and 2019 sales are shown in series at the top of the table and then just below a comparison of 2019 versus 2018 and 2018 versus 2017 is displayed. This provides an easy-to-view summary of all the data.
Microsoft
- Xbox One – Down Year-on-Year 316,749 (-24.7%)
Nintendo
- Nintendo Switch - Up Year-on-Year 720,546 (26.5%)
- Nintendo 3DS – Down Year-on-Year 414,424 (-44.3%)
Sony
- PlayStation 4 – Down Year-on-Year 745,056 (-19.2%)
- PlayStation Vita – Down Year-on-Year 68,398 (-72.2%)
A life-long and avid gamer, William D'Angelo was first introduced to VGChartz in 2007. After years of supporting the site, he was brought on in 2010 as a junior analyst, working his way up to lead analyst in 2012. He has expanded his involvement in the gaming community by producing content on his own YouTube channel and Twitch channel dedicated to gaming Let's Plays and tutorials. You can contact the author at wdangelo@vgchartz.com or on Twitter @TrunksWD.


 Essay Pro