Switch Dominates the Japanese Charts Once Again - Sales
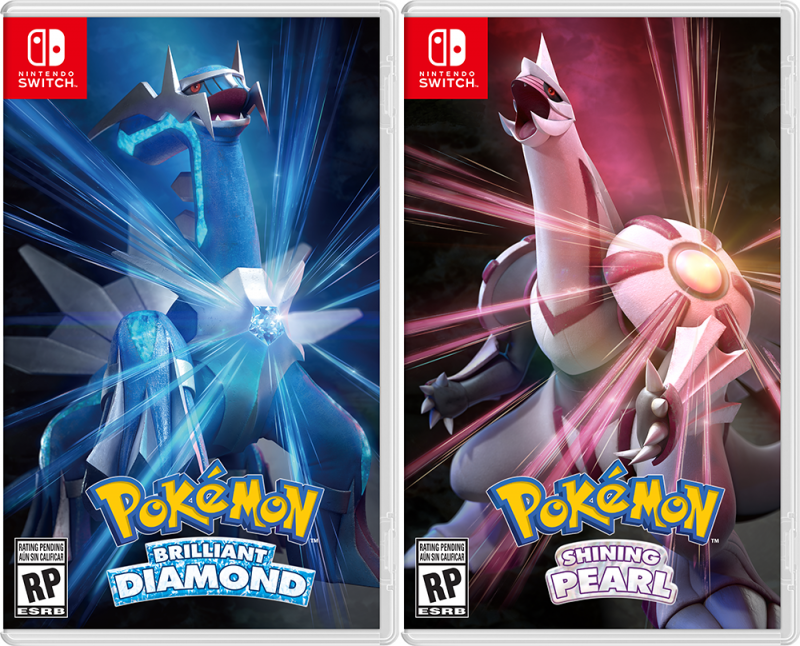
by William D'Angelo , posted on 23 December 2021 / 6,235 ViewsPokémon Brilliant Diamond / Shining Pearl (NS) has remained in first place on the retail charts in Japan with sales of 116,657 units, according to Famitsu for the week ending December 19, 2021.
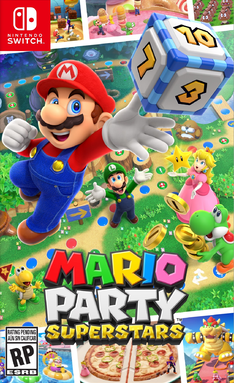
Mario Party Superstars (NS) is in second place with sales of 60,555 units. Big Brain Academy: Brain vs. Brain (NS) is in third place with sales of 33,796 units. Minecraft (NS) is in fourth place with sales of 29,638 units.
Mario Kart 8 Deluxe (NS) is in fifth place with sales of 28,075 units. Animal Crossing: New Horizons (NS) is in sixth place with sales of 27,260 units. Super Smash Bros. Ultimate (NS) is in seventh place with sales of 26,432 units.
The entire top 10 are games for the Nintendo Switch.
The Nintendo Switch was the best-selling platform with 176,832 units sold. The PlayStation 5 sold 8,664 units, the Xbox Series X|S sold 2,889 units, the 3DS sold 302 units, and the PlayStation 4 sold 61 units.

Here is the complete top 10:
- [NSW] Pokemon Brilliant Diamond / Shining Pearl (The Pokemon Company, 11/19/21) – 116,657 (2,162,697)
- [NSW] Mario Party Superstars (Nintendo, 10/29/21) – 60,555 (519,556)
- [NSW] Big Brain Academy: Brain vs. Brain (Nintendo, 12/03/21) – 33,796 (103,816)
- [NSW] Minecraft (Microsoft, 06/21/18) – 29,638 (2,365,783)
- [NSW] Mario Kart 8 Deluxe (Nintendo, 04/28/17) – 28,075 (4,219,343)
- [NSW] Animal Crossing: New Horizons (Nintendo, 03/20/20) – 27,260 (7,038,121)
- [NSW] Super Smash Bros. Ultimate (Nintendo, 12/07/18) – 26,432 (4,579,273)
- [NSW] Momotaro Dentetsu: Showa, Heisei, Reiwa mo Teiban! (Konami, 11/19/20) – 15,913 (2,464,196)
- [NSW] Pokemon Sword / Shield (The Pokemon Company, 11/15/19) – 14,234 (4,242,081)
- [NSW] Ring Fit Adventure (Nintendo, 10/18/19) – 13,903 (2,970,388)
Here is the hardware breakdown:
- Switch OLED Model – 93,406 (675,654)
- Switch – 46,372 (17,681,055)
- Switch Lite – 37,054 (4,364,738)
- PlayStation 5 – 7,790 (1,005,415)
- Xbox Series X – 2,282 (73,190)
- PlayStation 5 Digital Edition – 874 (191,533)
- Xbox Series S – 607 (53,832)
- New 2DS LL (including 2DS) – 302 (1,178,946)
- PlayStation 4 – 61 (7,819,177)
A life-long and avid gamer, William D'Angelo was first introduced to VGChartz in 2007. After years of supporting the site, he was brought on in 2010 as a junior analyst, working his way up to lead analyst in 2012. He has expanded his involvement in the gaming community by producing content on his own YouTube channel and Twitch channel dedicated to gaming Let's Plays and tutorials. You can contact the author at wdangelo@vgchartz.com or on Twitter @TrunksWD.
More Articles

About a 3:1 ratio for PS5 vs. Series X|S. Been averaging in that range, give or take, for many months now. Of course it's hard to know how much better each would sell if there were no supply constraints. But if that ratio continues to hold, then that's a win for Microsoft. Or maybe a loss for both of them (vs. the Switch). :)
Still, if you told Microsoft that they'd be pretty consistently averaging something in the 3:1 or 4:1 range vs. Sony in Japan before this generation began, they'd probably be very happy with that.

It's definitively a win for MS, having already outsold the Xbox One in a year. I think a lot of people expected even further decline of Xbox in Japan, but seeing this turnaround must be very encouraging to MS.
In regards to comparison with PS, then yes, it's also positive. The ratio to PS is almost nearing 360 levels, which was their best gen in the region.
PS2/Xbox: 98%/2%
PS3/360: 86%/14%
PS4/XOne: 99%/1%
PS5/XSXS: 90%/10%
Interesting stats, thanks for sharing them!
The PS5:Xbox Series ratio has been typically far better than 9:1 for many months. A combination of a bit of a bounce-back for xbox, and depressed PS5 sales, At launch the ratio was very lopsided in favour of PS5, but now it jumps around in the 2:1 to 4:1 range most weeks, so it seems to be approximately 3:1 on average.
I'm not sure how much the Japanese market even wants dedicated home game consoles right now, and it'll be interesting to see how things develop there at some future point when supply constraints lessen (whether that's 2022, or 2023, or what have you).