


2013 Year on Year Sales and Market Share Update to January 12th - News
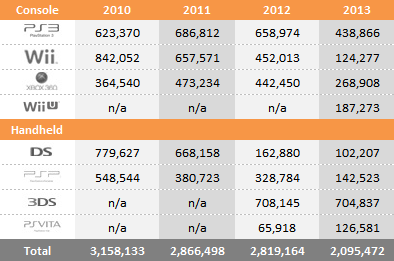
by William D'Angelo , posted on 20 January 2013 / 12,619 ViewsHere we see data representing the global sales through to consumers and change in sales performance of the three home consoles over comparable periods for 2010, 2011, 2012 and 2013. Also shown is the market share for each of the consoles over the same periods.
Year to Date Sales Comparison (Same Periods Covered)
Market Share – 7th Generation (Same Periods Covered)
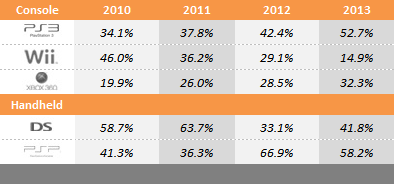
Market Share – 8th Generation (Same Periods Covered)

2010 – (Week beginning January 3 to January 16)
2011 – (Week beginning January 2 to January 15)
2012 – (Week beginning January 1 to January 14)
2013 – (Week beginning December 30 to January 12)
Total Sales and Market Share for Each Year – 7th Generation
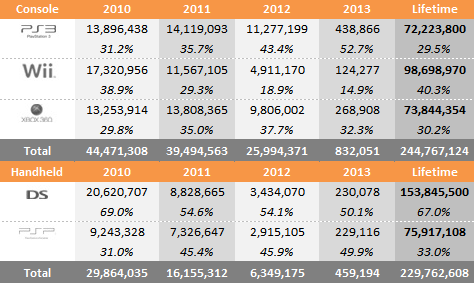
Total Sales and Market Share for Each Year – 8th Generation

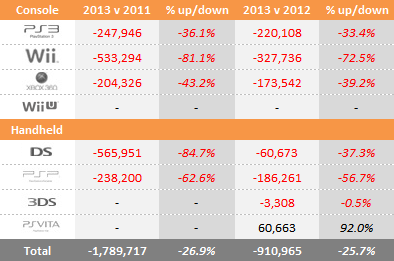
"Year to date" sales for 2010, 2011, 2012 and 2013 sales are shown in series at the top of the table and then just below a comparison of 2013 versus 2011 and 2013 versus 2012 is displayed. This provides an easy-to-view summary of all the data.
Microsoft
Xbox 360 - Down Year-on-Year 78,596, Year to Date -39.2%
Sony
PlayStation 3 – Up Year-on-Year 89,304, Year to Date -33.4%
PSP - Down Year-on-Year 52,078, Year to Date -56.7%
PlayStation Vita – Up Year-on-Year 18,039, Year to Date 92.0%
Nintendo
Nintendo Wii - Down Year-on-Year 102,742, Year to Date -72.5%
Nintendo DS - Down Year-on-Year 24,190, Year to Date -37.3%
Nintendo 3DS - Down Year-on-Year 29,625, Year to Date -0.5%
Nintendo Wii U – n/a
Contact VGChartz at wdangelo@vgchartz.com
More Articles

PS3 needs a pricecut, Microsoft needs a new console.

HD console sales are crashing. They will announce and release new consoles this year.
Neither PS3 or X360 will sell over 8 million consoles in 2013. Consumers are waiting for the next gen systems to arrive later in the year.

Sales show that Microsoft will soon give X360 a nice pricecut, is it still officially 299$???


 Essay Pro