


2012 Year on Year Sales and Market Share Update to June 30th - News
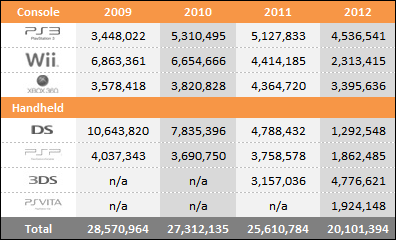
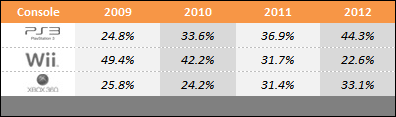
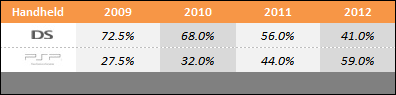
by William D'Angelo , posted on 11 July 2012 / 9,791 ViewsHere we see data representing the global sales through to consumers and change in sales performance of the three home consoles over comparable periods for 2009, 2010, 2011 and 2012. Also shown is the market share for each of the consoles over the same periods.
Year to Date Sales Comparison (Same Periods Covered)
Market Share (Same Periods Covered)
2009 – (Week beginning January 4 to July 4)
2010 – (Week beginning January 3 to July 3)
2011 – (Week beginning January 2 to July 2)
2012 – (Week beginning January 1 to June 30)
Total Sales and Market Share for Each Year
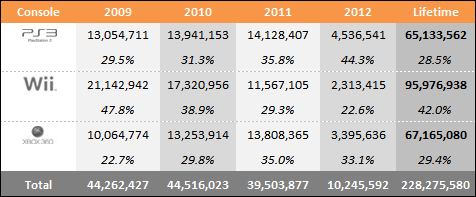
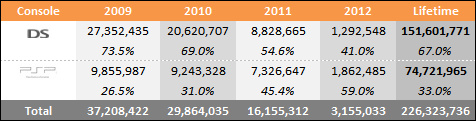
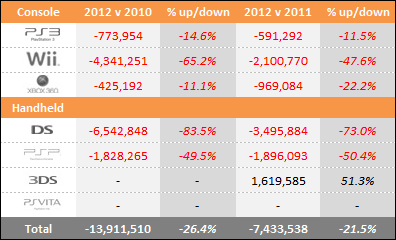
"Year to date" sales for 2009, 2010, 2011 and 2012 sales are shown in series at the top of the table and then just below a comparison of 2012 versus 2010 and 2012 versus 2011 is displayed. This provides an easy-to-view summary of all the data.
Microsoft
Xbox 360 - Down Year-on-Year 60k, Year to Date -22.2%
Sony
PlayStation 3 – Down Year-on-Year 59k, Year to Date -11.5%
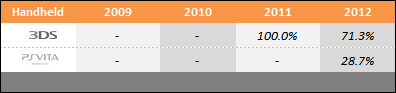
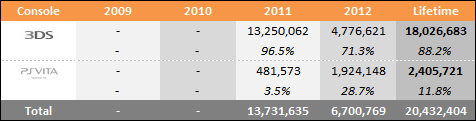
PlayStation Vita - n/a
Nintendo
Nintendo Wii - Down Year-on-Year 102k, Year to Date -47.6%
Nintendo 3DS - Up Year-on-Year 60k, Year to Date 51.3%
Contact VGChartz at wdangelo@vgchartz.com
More Articles

the ps vita is catching up

he 3DS XL is showing it's effect on the sales for the system. Hopefully, the upcoming games will keep it up

it isnt even out yet

Next week Playstation and Xbox 360 will have 2million gap.

Whoops, forgot to put "sales" after the second horrible
Horrible, Horrible from all 3 consoles in 2012. Good to see the ps3 is at least above the 2009 numbers. 360 is not bad but not very good either, and Wii is just horrendous.

About time this generation ended. Getting tired of all the sequels. Of the games which sold above 3 million this generation, how many don't have direct sequels? Red Dead Redemption, MGS4, and a handful of old Nintendo IP's are the only one that comes to mind, but they are sequels from past gens.


 Essay Pro