


2026 Worldwide Sales Comparison Charts Through January - Switch 2 vs PS5 vs Xbox Series vs Switch - Sales
by William D'Angelo , posted on 01 March 2026 / 5,389 ViewsHere we see data representing the sales through to consumers and change in sales performance of the four platforms still on the market (Nintendo Switch 2, PlayStation 5, Xbox Series X|S, and Nintendo Switch 1) over comparable periods for 2023, 2024, 2025, and 2026. Also shown is the market share for each of the consoles over the same periods.
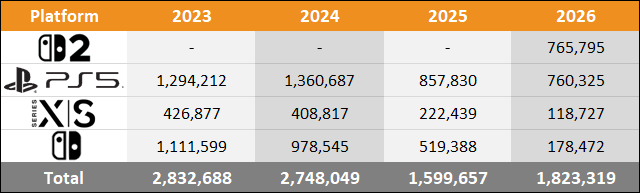
Year to Date Sales Comparison (Same Periods Covered)
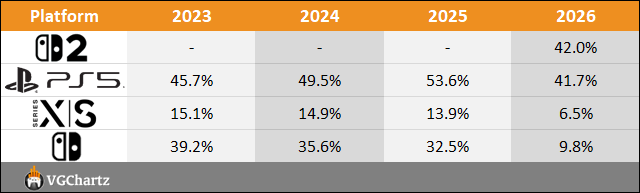
Market Share (Same Periods Covered)
2021 – (January 2023 to January 2023)
2022 – (January 2024 to January 2024)
2023 – (January 2025 to January 2025)
2024 – (January 2026 to January 2026)
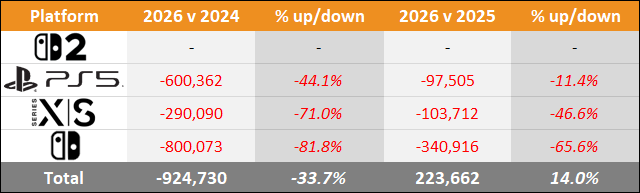
"Year to date" sales for 2023, 2024, 2025, and 2026 sales are shown in series at the top of the table and then just below a comparison of 2026 versus 2025 and 2026 versus 2024 is displayed. This provides an easy-to-view summary of all the data.
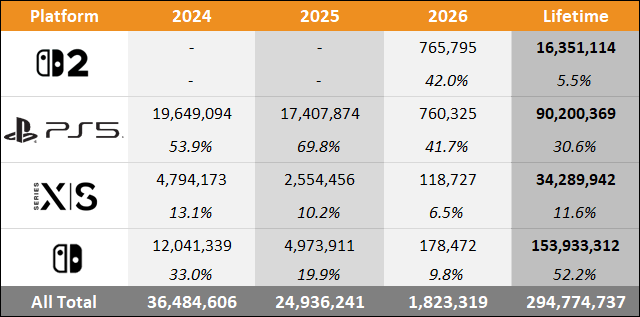
Total Sales and Market Share for Each Year
Nintendo
- Nintendo Switch 2
- 765,795 units sold year-to-date
- Nintendo Switch 1
- 178,472 units sold year-to-date
- Down year-on-year 340,916 units (-65.6%)
Sony
- PlayStation 5
- 760,325 units sold year-to-date
- Down year-on-year 97,505 units (-11.4%)
Microsoft
- Xbox Series X|S
- 118,727 units sold year-to-date
- Down year-on-year 103,712 units (-46.6%%)
Note: VGChartz 2026, 2025, and 2023 estimates through January includes 4 weeks, while 2024 estimates includes 5 weeks.
A life-long and avid gamer, William D'Angelo was first introduced to VGChartz in 2007. After years of supporting the site, he was brought on in 2010 as a junior analyst, working his way up to lead analyst in 2012 and taking over the hardware estimates in 2017. He has expanded his involvement in the gaming community by producing content on his own YouTube channel and Twitch channel. You can follow the author on Bluesky.