


Japan Yearly Chart
The year's top-selling games at retail ranked by unit sales
| Yearly Chart Index | ||
| Global | ||
| USA | Europe UK Germany France | Japan |
| Pos | Game | Weeks | Yearly | Total | ||||
|---|---|---|---|---|---|---|---|---|
| 1 |
|
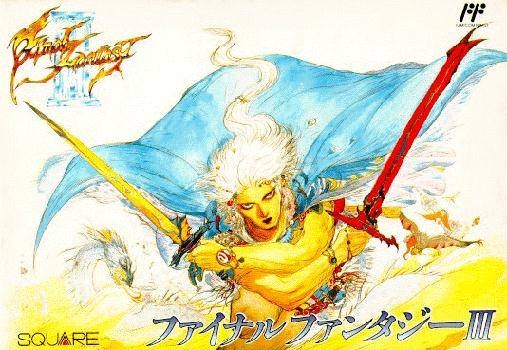
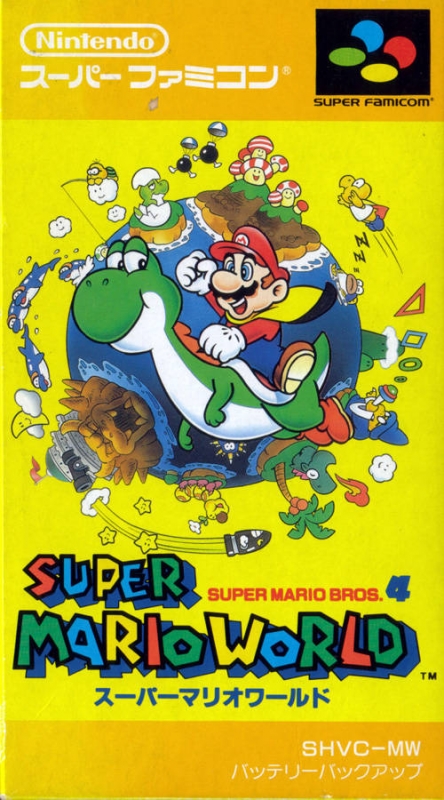
46 | 2,988,284 | 2,988,284 | ||||
| 2 |
|
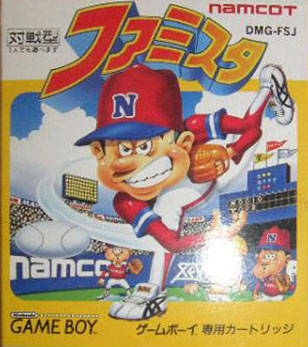
36 | 1,313,128 | 1,313,128 | ||||
| 3 |
|
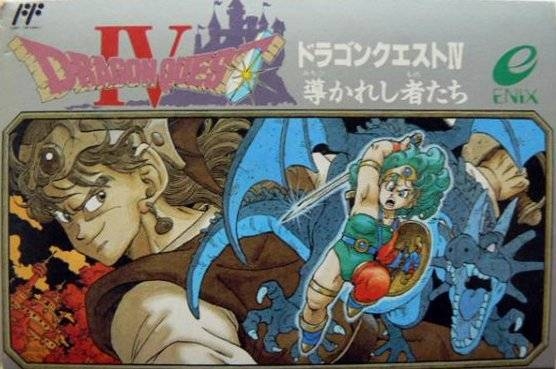
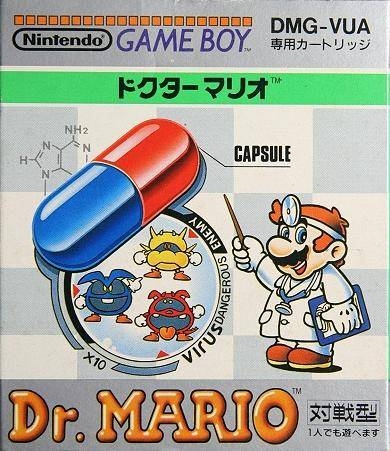
81 | 989,213 | 1,936,470 | ||||
| 4 |
|
23 | 983,661 | 983,661 | ||||
| 5 |
|
89 | 969,859 | 1,905,996 | ||||
| 6 |
|
14 | 935,944 | 935,944 | ||||
| 7 |
|
6 | 450,396 | 450,396 | ||||
| 8 |
|
14 | 345,972 | 345,972 | ||||
| 9 |
|
16 | 313,399 | 313,399 | ||||
| 10 |
|
8 | 251,445 | 251,445 | ||||
| 11 |
|
6 | 157,277 | 157,277 | ||||
| 12 |
|
2 | 144,490 | 144,490 | ||||
| 13 |
|
2 | 99,215 | 99,215 | ||||


Check the VGChartz Methodology page for more information on regional definitions and how data is arrived at.
HTML Code:
Forum Code:
Japan Hardware by Platform
| Platform | Yearly (change) | Total | |
|---|---|---|---|
| GB | 2,706,715 | (+114%) | 3,971,167 |
| SNES | 519,738 | (++114%) | 519,738 |
| Total | 3,226,453 | (+155%) | |
Japan Software by Platform
| Platform | Yearly (change) | Total | |
|---|---|---|---|
| NES | 5,775,535 | (N/A) | 5,775,535 |
| GB | 3,459,860 | (+84%) | 5,343,254 |
| SNES | 706,888 | (++84%) | 706,888 |
| Total | 9,942,283 | (+428%) | |