2014 Year on Year Sales and Market Share Update to January 11th - News
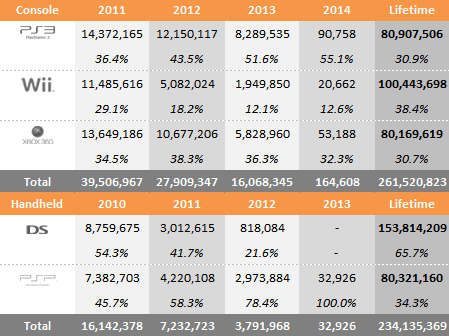
by William D'Angelo , posted on 22 January 2014 / 8,505 ViewsHere we see data representing the global sales through to consumers and change in sales performance of the four home consoles and four handhelds over comparable periods for 2010, 2011, 2012 and 2013. Also shown is the market share for each of the consoles over the same periods.
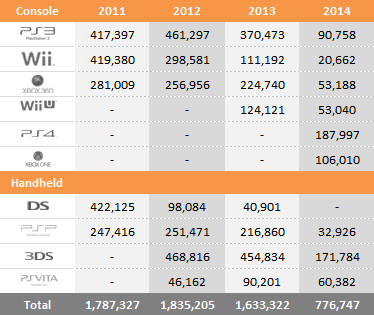
Year to Date Sales Comparison (Same Periods Covered)
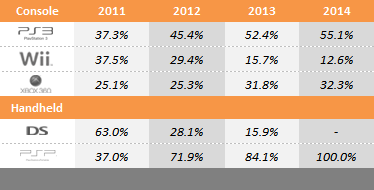
Market Share – 7th Generation (Same Periods Covered)
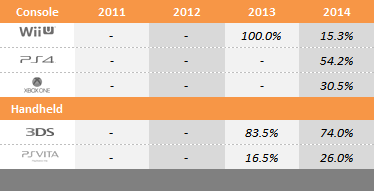
Market Share – 8th Generation (Same Periods Covered)
2011 – (Week beginning January 2 to January 8)
2012 – (Week beginning January 1 to January 7)
2013 – (Week beginning December 30 to January 6)
2014 – (Week beginning January 5 to January 11)
Total Sales and Market Share for Each Year – 7th Generation
Total Sales and Market Share for Each Year – 8th Generation
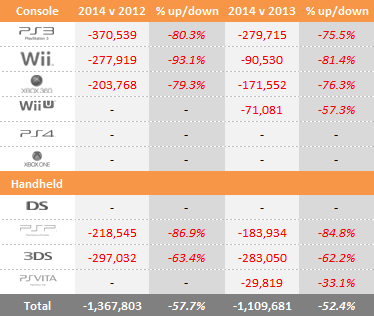
"Year to date" sales for 2010, 2011, 2012 and 2013 sales are shown in series at the top of the table and then just below a comparison of 2013 versus 2011 and 2013 versus 2012 is displayed. This provides an easy-to-view summary of all the data.
Microsoft
Xbox 360 - Down Year-on-Year 88,835, Year to Date -76.3%
Xbox One – n/a
Sony
PlayStation 3 – Down Year-on-Year 98,854, Year to Date -75.5%
PSP - Down Year-on-Year 88,141, Year to Date -84.8%
PlayStation Vita – Up Year-on-year 19,217, Year to Date -33.1%
PlayStation 4 – n/a
Nintendo
Nintendo Wii - Down Year-on-Year 41,895, Year to Date -81.4%
Nintendo DS – n/a
Nintendo 3DS – Down Year-on-Year 24,542, Year to Date -62.2%
Nintendo Wii U – Up Year-on-Year 4,653, Year to Date -57.3%
________________________________________________________________________________________
A life-long and avid gamer, William D'Angelo was first introduced to VGChartz in 2007. After years of supporting the site, he was brought on in 2010 as a junior analyst, working his way up to lead analyst in 2012. He has expanded his involvement in the gaming community by producing content on his own YouTube channel dedicated to gaming Let's Plays and tutorials. Outside, in the real world, he has a passion for the outdoors which includes everything from hiking to having received his B.A. in Environmental Studies. You can contact the author at wdangelo@vgchartz.com.
More Articles

You do realize that week ending January 4th would technically be the 1st week of 2014, not the 53rd week of 2013. It's not fair to compare 1 week of 2014 to 2 weeks for previous years

Ps4 at 54% without japan...................
You are right. This is not going to be pretty.

And no stock. Expect to see 250k+ in coming weeks while the others struggle

Most are way down yoy though this years dates the 5th to the 11th is almost a week after last years the 30th to the 6th with only two days of overlap so that probably increased the drop a bit.
actually it should be the 30th to the 5th for last year so only one day of overlap and it looks like there have been some minor adjustments from when you collected the data
3DS 457,821 (-38%) 28,164,943
PS3 383,718 (-25%) 73,741,536
X360 227,527 (-44%) 75,094,640
PSP 219,245 (+7%) 77,670,793
WiiU 123,651 (-39%) 2,370,867
Wii 118,654 (-45%) 98,793,113
PSV 90,675 (-36%) 4,246,714
DS 40,901 (-55%) 153,037,026
Those drops! PS4 and Xbone had better see increases or this year is going to be beyond awful.
the drops are bad though the lack of overlap in the dates makes it even worse.
Last year the 6th through the 12th
3DS 196,326 (-57%) 28,361,269
PS3 189,612 (-51%) 73,931,148
X360 142,023 (-38%) 75,236,663
PSP 121,067 (-45%) 77,791,860
Wii 62,557 (-47%) 98,855,670
WiiU 48,387 (-61%) 2,419,254
PSV 41,165 (-55%) 4,287,879
DS 24,913 (-39%) 153,061
so quite a bit less than the week it's currently being compared to.